Dashboard
The headline page for every workspace. One XEO composite score, three sub-scores with deltas, model citation rates, and projected scores at three, six, twelve months.
Executive summary
Three short paragraphs explaining the feature and value.
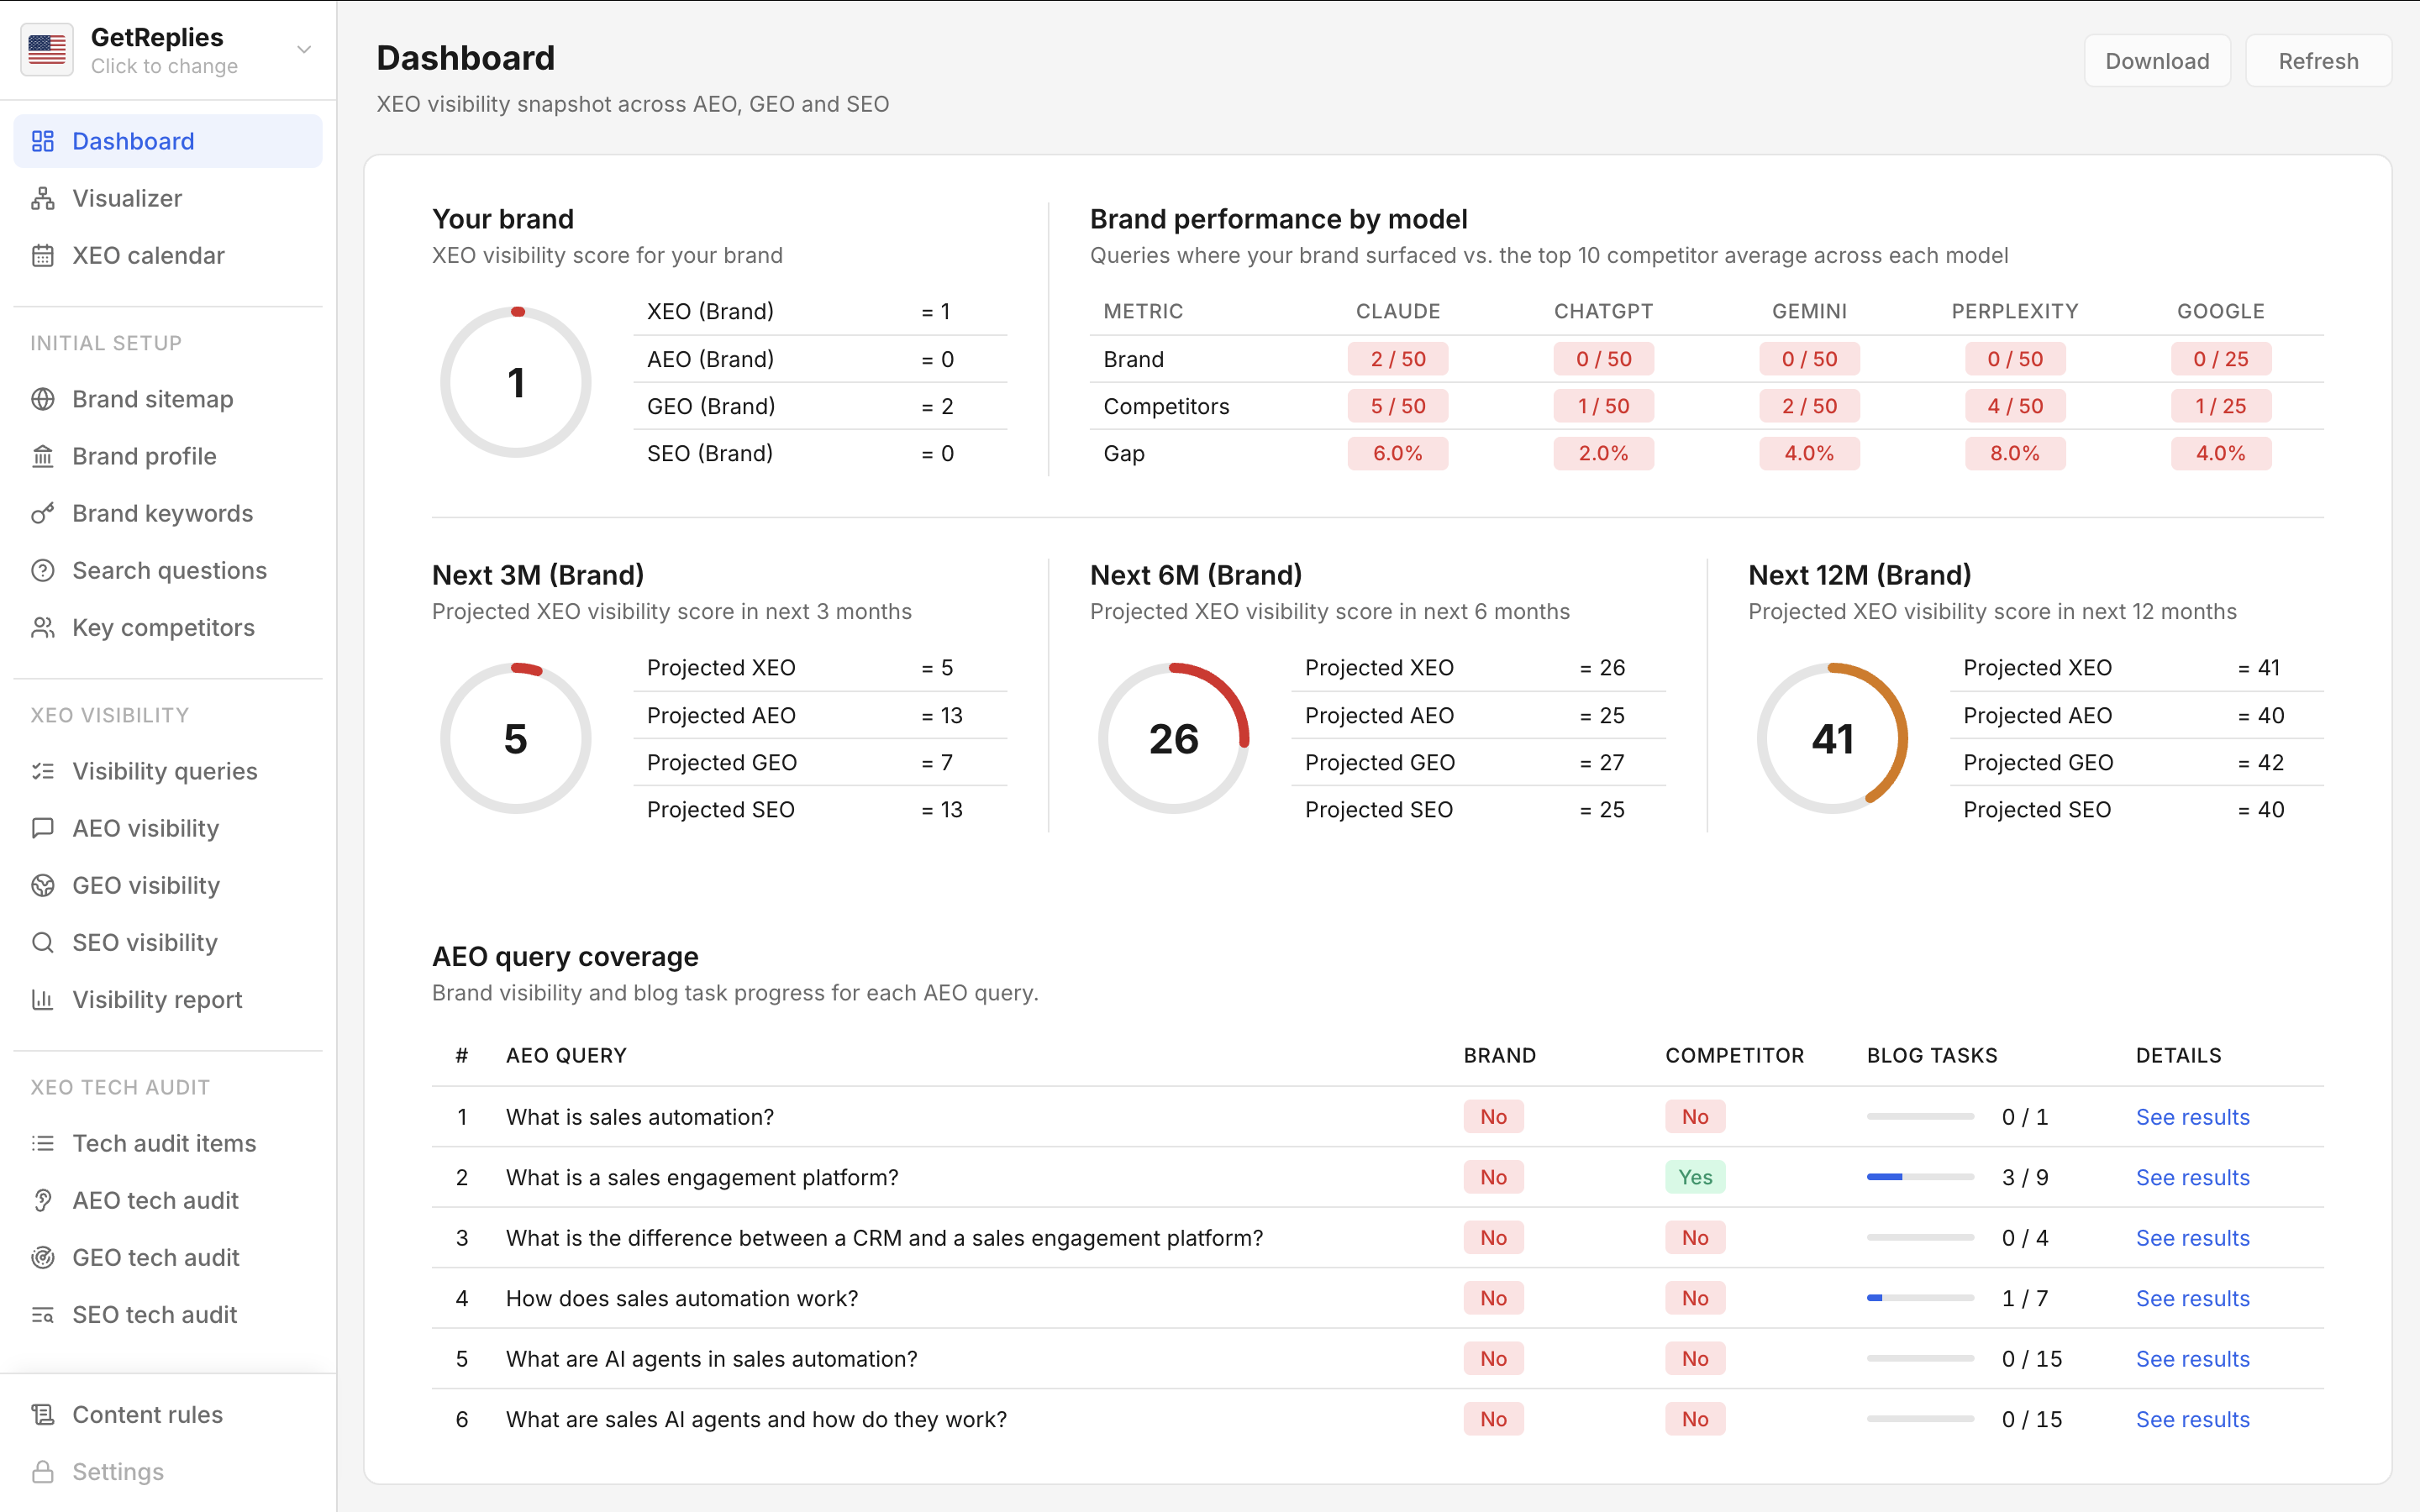
The Dashboard is the headline page for every GetXEO workspace. One XEO composite score lives at the top, alongside three sub-scores for AEO, GEO, and SEO. Each carries a delta column showing how much it moved since the last scan, so the user knows whether their work is paying off.
Below the score view, a Brand performance by model panel shows how often the brand surfaces inside each AI model individually. The asymmetry across models is often where the work hides: a brand cited consistently in one model might be invisible inside another, and the gap is actionable.
A Projected scores panel sits below the model panel showing where the brand is headed at three, six, and twelve months if the current trajectory holds. Projections are AI generated and probabilistic, not promises, but they translate the current pace into a forecast leadership can plan against confidently.
Key highlights
Five capability points teams should know about quickly.
- One XEO composite score with three sub-scores
- Delta column showing change since last scan
- Brand performance per AI model panel
- Projected scores at three, six, twelve months
- PDF report ready for stakeholder review
Top FAQs
Five common questions answered for fast practical clarity.
What does the Dashboard show?
It shows the headline XEO composite score alongside three sub-scores for AEO, GEO, and SEO, each with a delta versus the previous scan. Below, a panel breaks down brand citation rates across AI models, plus projected scores at three, six, and twelve months.
How often should I check the Dashboard?
Most marketers open the Dashboard daily on Monday to see whether last week's content moved any scores, and again on Friday to summarise the week. Scans run on demand, so checking more often than the scan cadence shows the same numbers. Weekly is the rhythm that matches typical scan frequency.
Are the projected scores reliable?
Projections are AI generated and probabilistic. They assume the current trajectory holds: same content cadence, same audit fixes, same competitor behaviour. Treat them as a directional forecast for planning, not a guarantee. The actual scores update as fresh scans land, replacing the projected band with measured values.
Can I export the Dashboard?
Yes. The Dashboard exports as a single PDF report with the composite score, sub-scores, the brand performance by model panel, and the projected scores formatted for executive review. The PDF generates client side via jsPDF, so download is instant and works without a server round trip from any browser session.
Does every workspace have its own Dashboard?
Yes. Every workspace has an independent Dashboard with its own scores, deltas, model performance panel, and projection panel. Switching workspaces from the top nav loads the new workspace's Dashboard within a second. Workspace specific scoping is the entire point: agency users with many clients see clean per brand numbers without contamination.